The Voronoi Problem

Computational Geometry - Algorithm

Problem description

Image for second paragraph

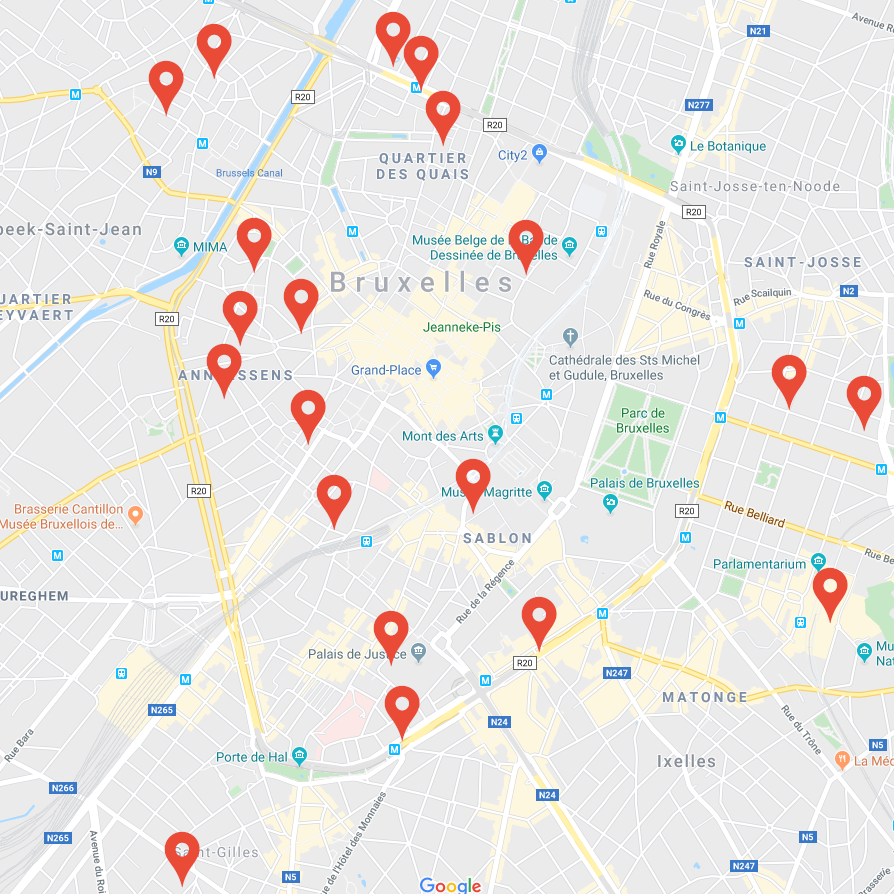
Imagine you have a map of your town with all the ice cream shops marked on it. You and your friends want to find out which ice cream shop is the closest to each of your houses. Instead of checking each shop one by one, you use a special kind of map called a Voronoi diagram.

In this special map, the town is divided into regions, where each region belongs to one ice cream shop. Every point within a region is closer to its corresponding ice cream shop than to any other shop. So, if you’re standing anywhere in a particular region, you know exactly which ice cream shop you should go to because it’s the closest one.
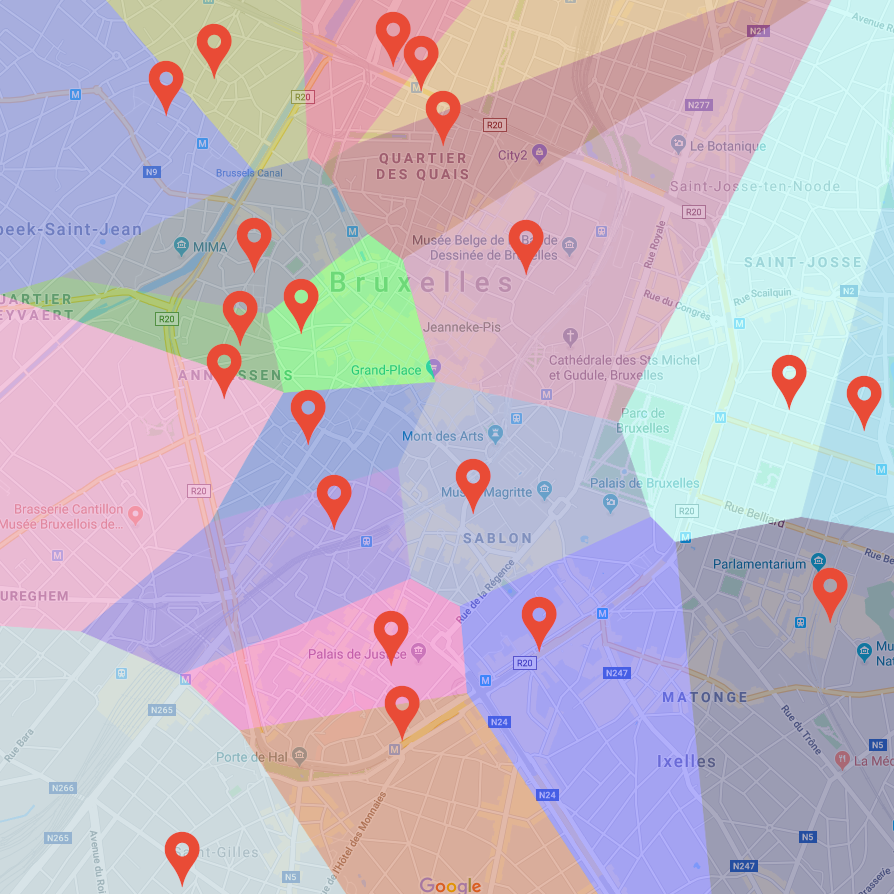
Image for second paragraph

Creating this special map for a large town with many ice cream shops could take a lot of time if done manually. But with the Fortune’s algorithm, we can make this map quickly and efficiently. This algorithm helps us draw the boundaries of each region in such a way that finding the nearest ice cream shop for any location becomes super easy and fast.

So, the Voronoi problem is all about figuring out these regions for a set of points (ice cream shops) on a map, so you can always find out which shop is closest to any given spot in the town.
Applet

Click to add a ice cream shop. The Voronoi diagram is updated on the go.

The Fortune’s algorithm

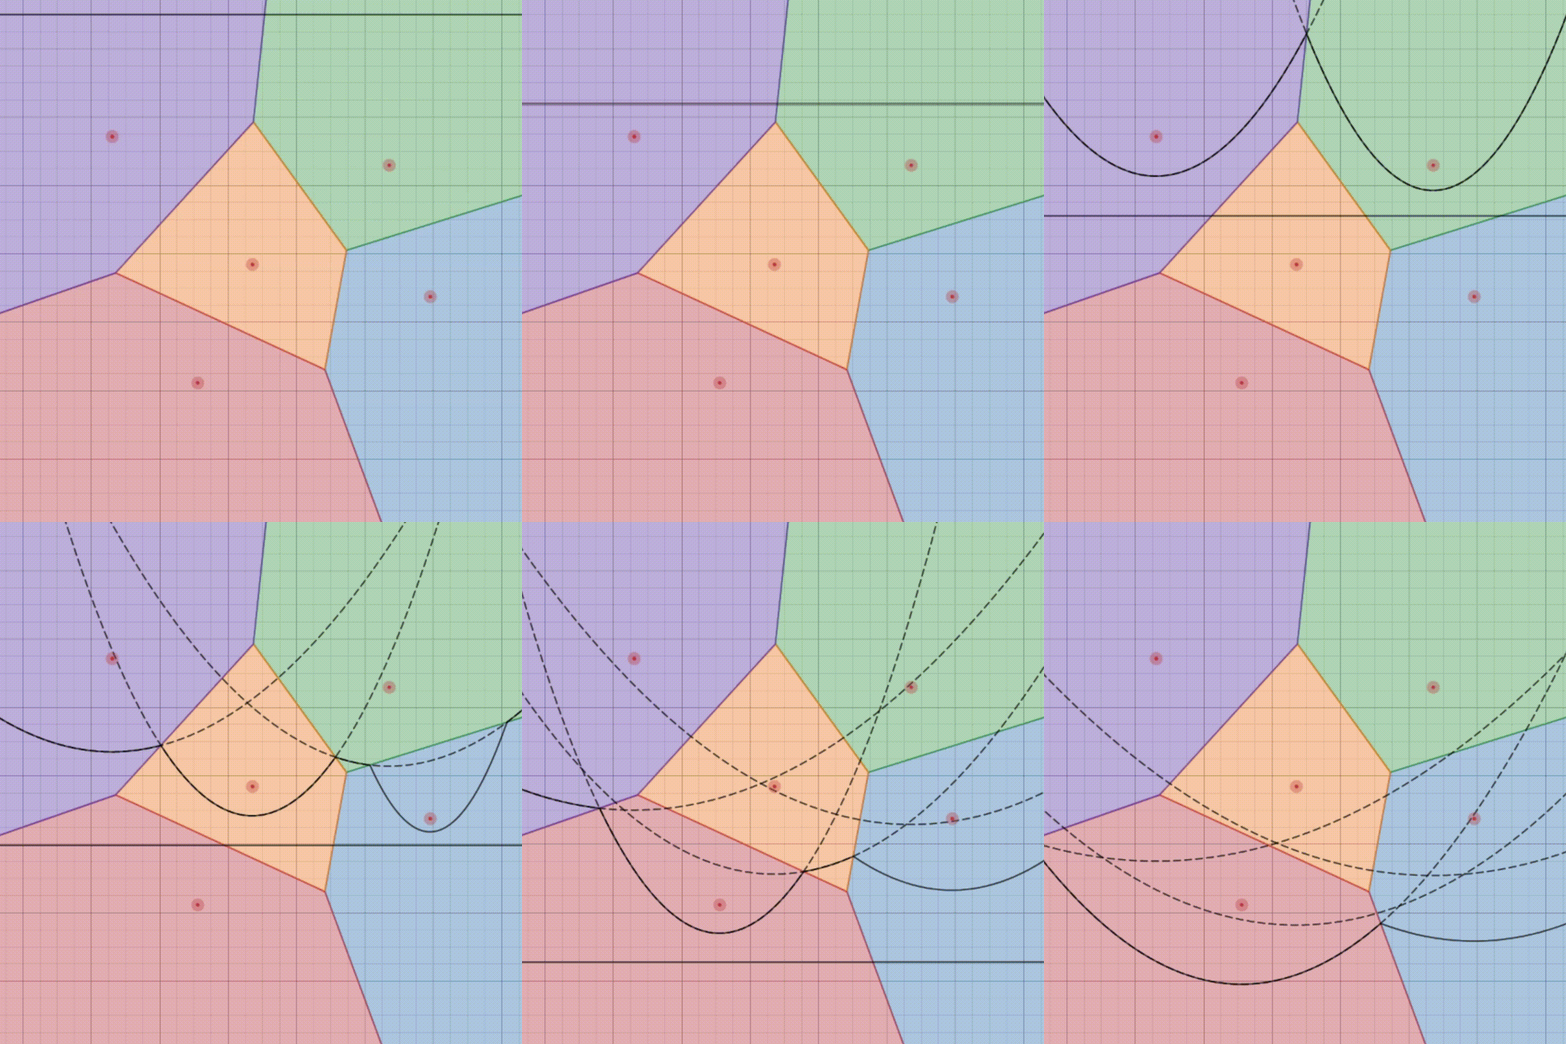
The Fortune's algorithm generates the Voronoi diagram of any set of points P in O(n log n) time. It's a sweep line algorithm: the algorithm moves a line in a direction (let's suppose here, without lost of generality, to the bottom) and executes some actions if some events occur. During all the process the algorithm maintains a data structure. At the begining the sweep line is at the top side.

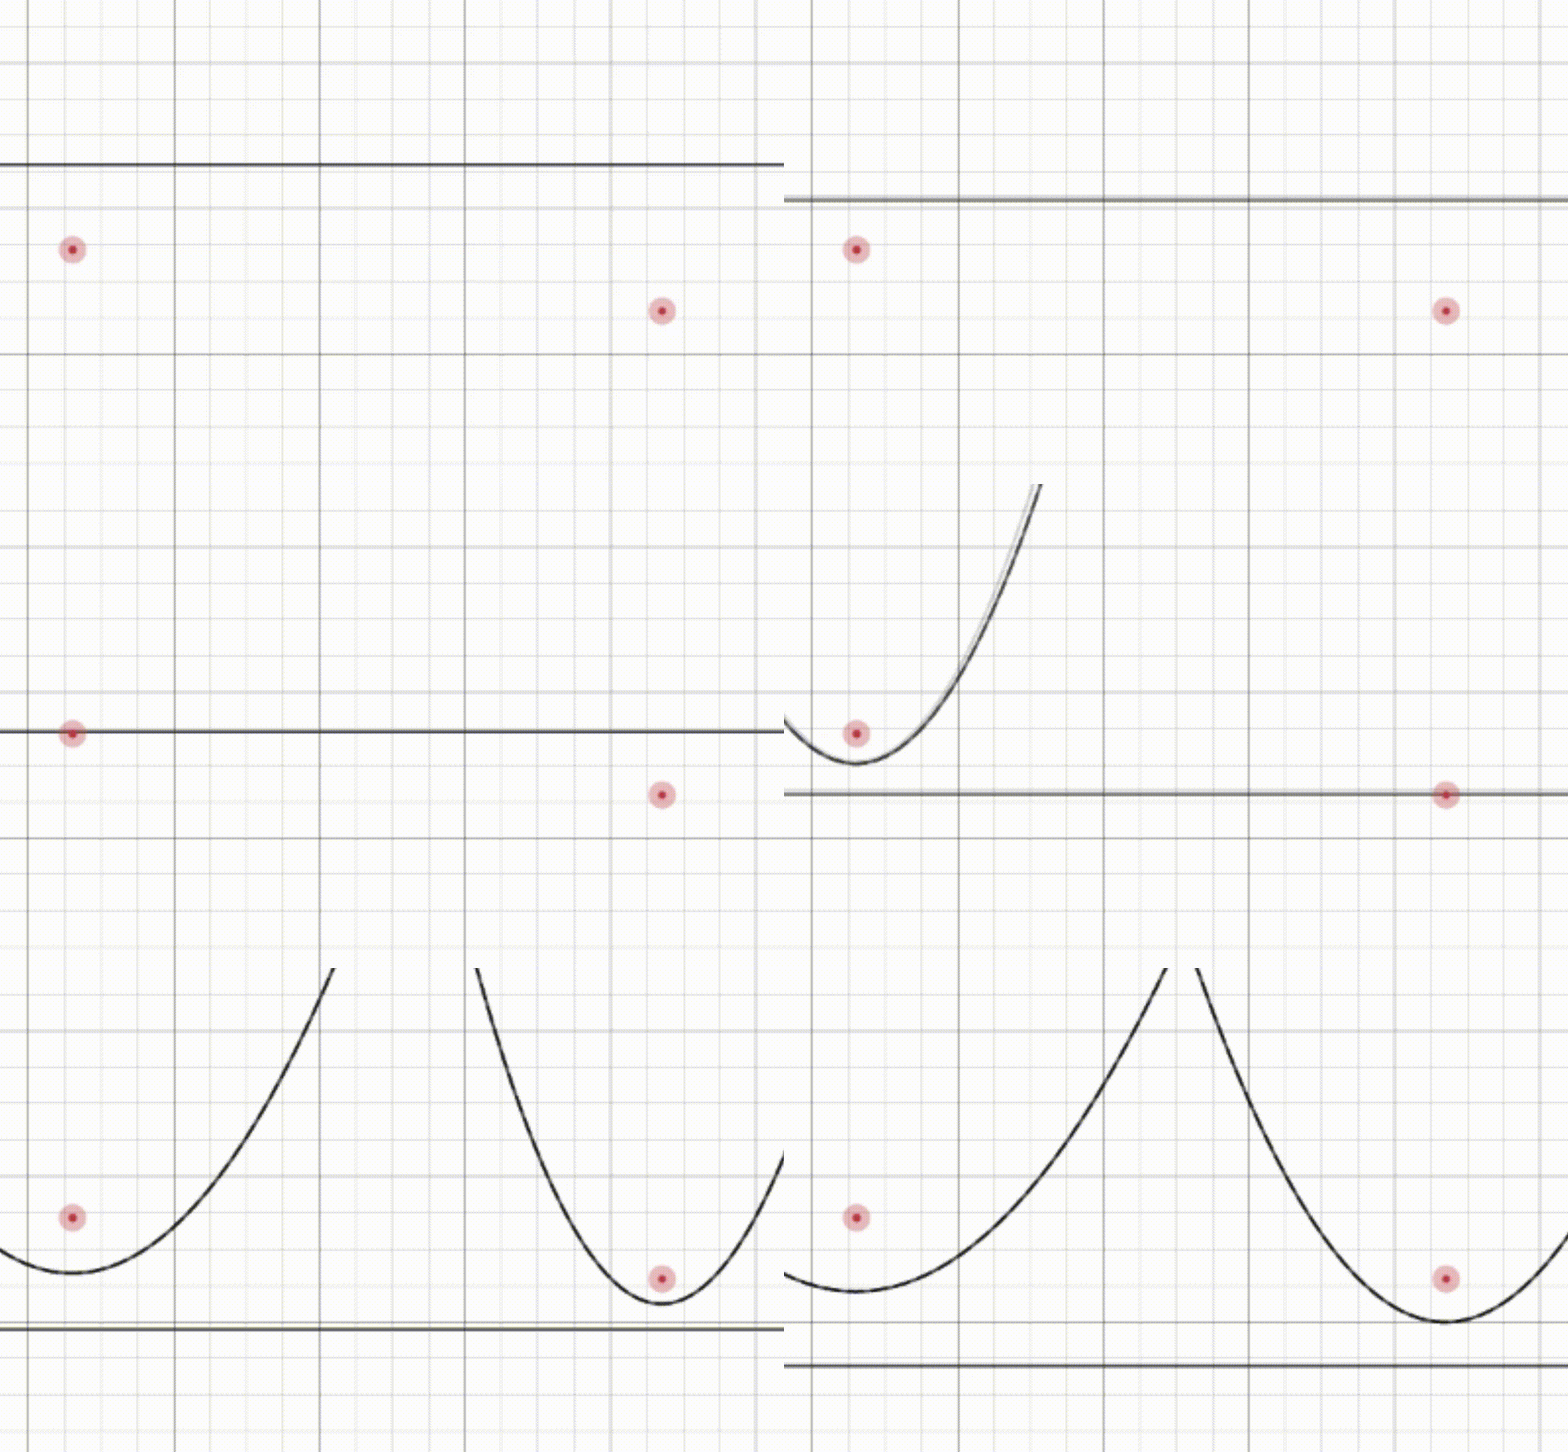
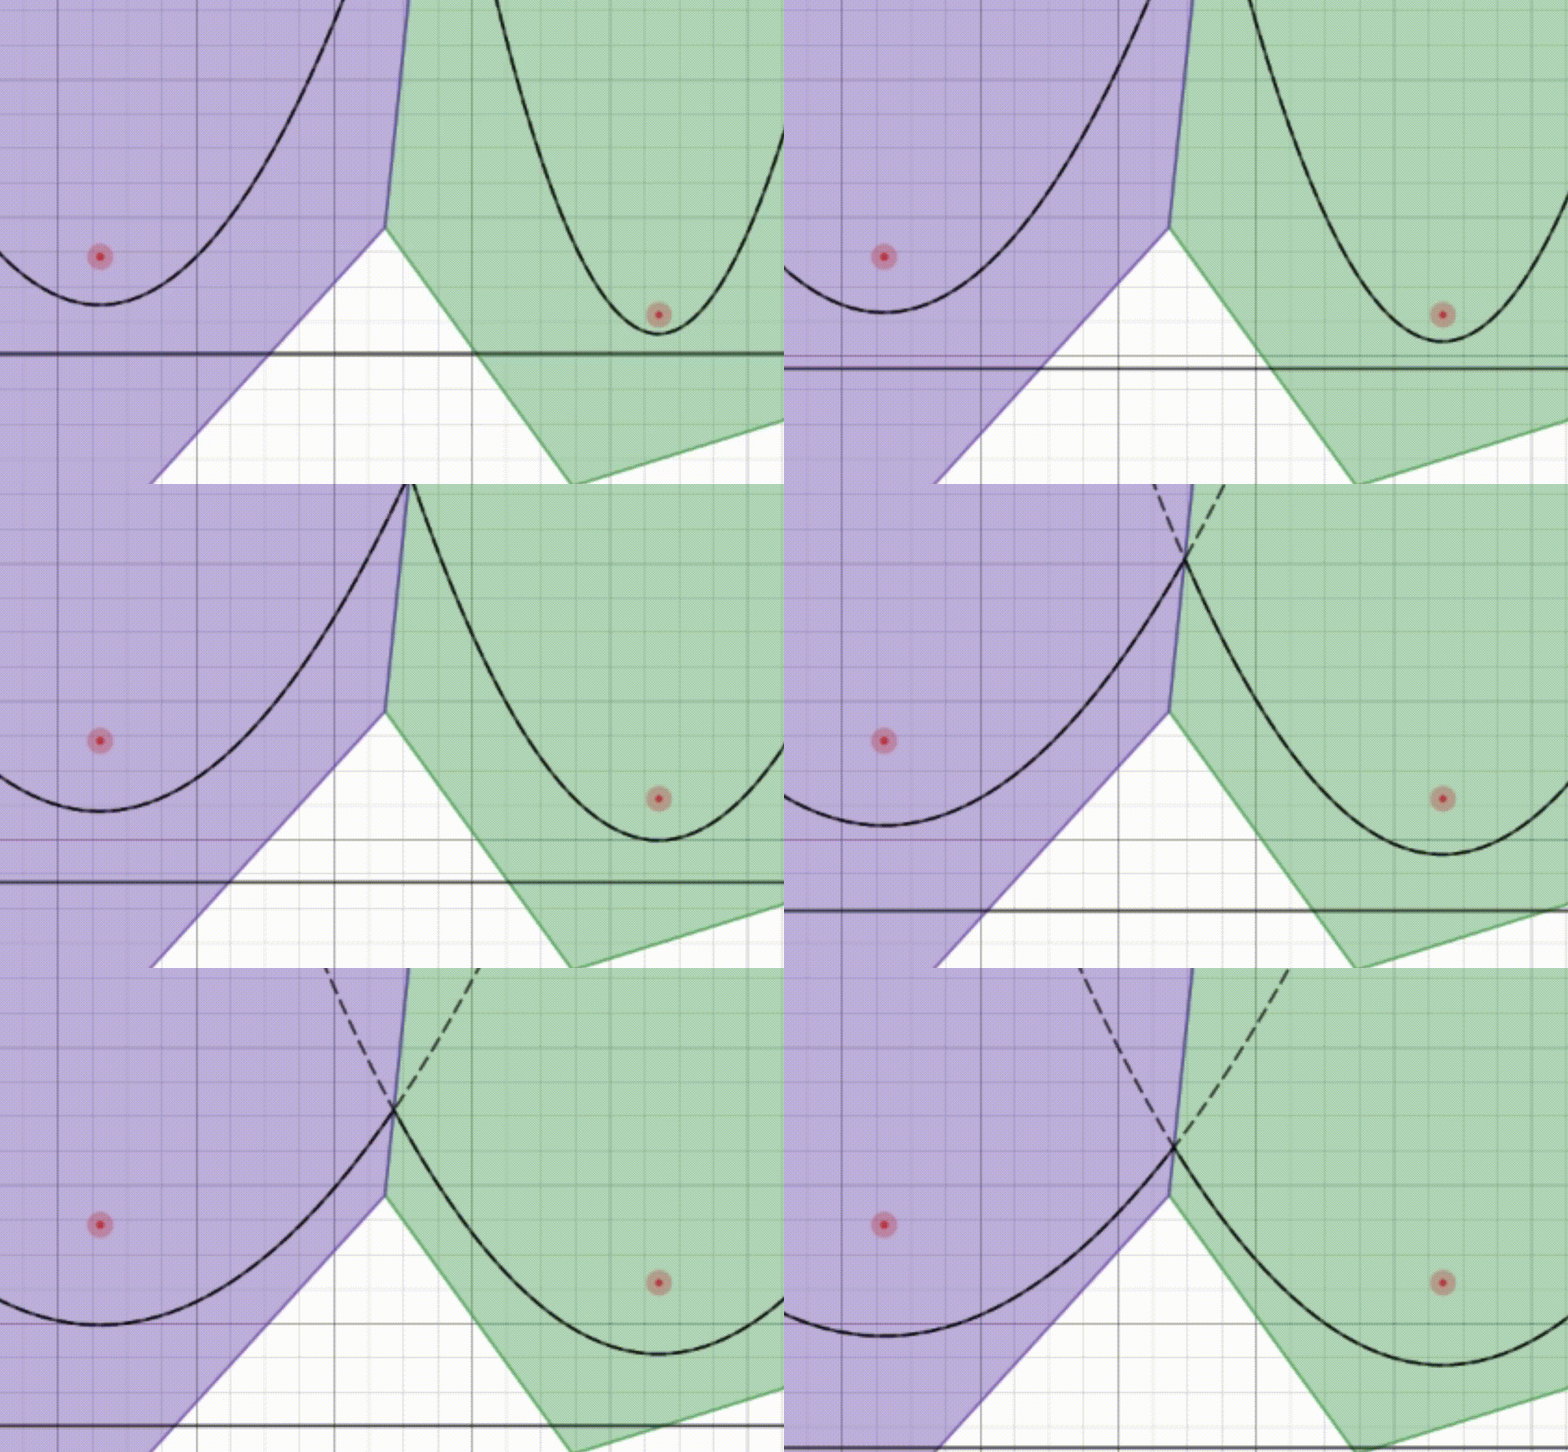
The idea is the following: the algorithm will move the line and cuts the half-plane at the top of the line (the half-plane already covered) in cells. For some points in the top half-plane it can already determine whose is the nearest neighbor in P. In practice, for each point p of P already covered by the line, the points in the top half-plane whose the nearest neighbor is p form a parabola. We denote parp(t) the parabola for the point p of P at time t because it depends on the position of the sweep line as illustrated by the animation.

When two parabolas collapse, for example parp and parq, the intersection is the set of points at same distance from p and q. Formally the intersection between parp and parq is given by ⋃t (parp(t) ∪ parq(t)). In other words it is an edge of VorP (more precisely it s the edge separating VorP(p) and VorP(q)). On the illustration the green part and the blue part are the final cells of the two points, they are represented for the understanding only.

References & Sources

[1] M. de Berg, M. van Kreveld, M. Overmars, O. Schwarzkopf, Computational Geometry: Algorithms and Applications, 1999. Pages 158-159 in the third edition.
[2] G. Aloupis, H. Pérez-Rosés, G. Pineda-Villavicencio, P. Taslakian, D. Trinchet-Almaguer Fitting Voronoi Diagrams to Planar Tesselations, 2013,
[3] https://github.com/gorhill/Javascript-Voronoi
[4] https://www.desmos.com/calculator/ejatebvup4
[5] S. Fortune, A Sweepline Algorithm for Voronoi Diagrams , 1987,